


 14 / 32

14
Free issue of MICHAEL
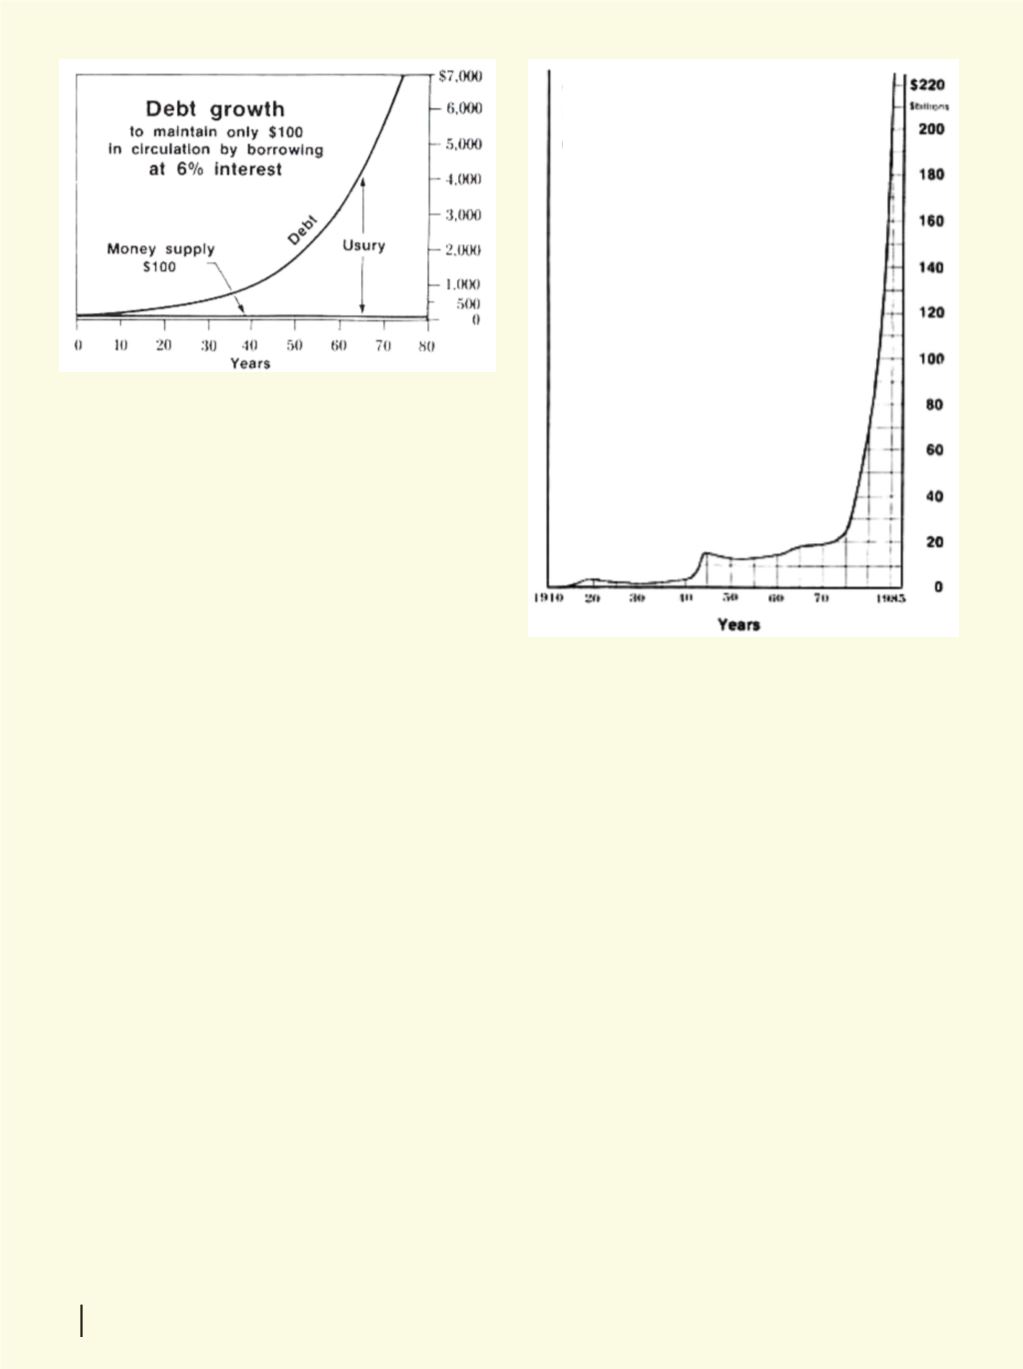
w ww.michaeljournal.o rgThe curve is quite flat at the beginning, but then
becomes steeper as time goes on. The debts of all
countries follow the same pattern, and are increas-
ing in the same way. Let us study, for example, Can-
ada’s public debt.
When Canada was founded in 1867 (the union of
four provinces — Ontario, Quebec, New Brunswick,
and Nova Scotia), the country’s debt was $93 mil-
lion. The first major increase took place during World
War I (1914-18), when Canada’s public debt went up
from $483 million in 1913 to $3 billion in 1920. The
second major increase took place during World War
II (1939-45), when the debt went up from $4 billion in
1942 to $13 billion in 1947. These two increases may
be explained by the fact that the Government had to
borrow large sums of money in order to take part in
these two wars.
But how can be explained the phenomenal in-
crease of these last years, when the debt almost in-
creased ten times, passing from $24 billion in 1975
to $224 billion in 1986, in peacetime (then $575 bil-
lion in 1996), when Canada had no need to borrow
for war ? It is the effect of
compound interest
, like
in the example of the island in
The Money Myth Ex-
ploded
.
Debts of federal governments represent huge
sums, but they are only the peak of the iceberg: If
there are public debts, there are also private debts !
The Federal Government is the biggest single bor-
rower, but not the only borrower in the country:
there are also individuals and companies. In the
United States, in 1992, the public debt was $4 tril-
lion, and the total debt was $16 trillion, with an
existing money supply of only $950 billion. In 2006,
the debt of the U.S. government reached $17 tril-
lion, and the total debt (states, corporations, con-
sumers) was over $100 trillion!
In his November 1993 report, Canada’s Auditor
General calculated that of the $423 billion in net
debt accumulated from Confederation to 1992, only
$37 billion went to make up the shortfall in program
spending. The remaining $386 billion covered what
it has cost to borrow that $37 billion. In other words,
91% of the debt consisted of interest charges, the
Government having spent only $37 billion (8.75% of
the debt) for actual goods and services.)
Fortuantely, more and more people understand
this fraudulent scheme of creating money as a debt.
example, Mr. Gilbert Vik of Cathlamet, Washington,
wrote a few years ago, this very interesting letter:
“For every person in our country, there is
$20,000 of money in existence. Sounds good! But
there is $64,000 of debt ! Apply your $20,000 to the
debt, and that money will cease to exist, leaving
you without any money and $44,000 of debt. Your
options are to forfeit your assets or borrow more
money to attempt to pay. You cannot borrow your-
self out of debt !
“Since the method of money creation is itself
the cause of the ever-increasing debt, it is not pos-
sible to correct the problem using any method that
deals with money after it has been created.
“Working harder will not correct it. Working
longer hours will not correct it. Having a job for
everyone in the family will not correct it. Neither
raising nor lowering wages will correct it. Full em-
ployment will not correct it. Less spending will not
correct it. More spending will not correct it.
(And
the list goes on...)
Canada
Public debt
(in billions of dollars)
1867: S93 million
1913: $483 million
1920: $3 billion
1942: $4 billion
1947: $13 billion
1975: $24 billion
1986: $224 billion
u
w
w .michaeljournal.orgFree issue of MICHAEL